General Linear Model for Analyzing fMRI Data
Date: December 20, 2023 10:05 AM
From this course: General Linear Model for Analyzing fMRI Data by Idan Blank
Summary: Theoretical and conceptual basis for General Linear Model fMRI analysis on a single participant, how to execute it in matlab
Example Experiment
Question: which brain regions are engaged in the decoding of semantics, syntax and meaning from sentences?
Test: Reading sentences
Control: Reading nonwords with the same number of words as the sentence
Basic T-test:
T = experiment signal, the brain signal during test condition
C = control signal, brain during control condition
t = mean(T) - mean(C)
noise
noise = standard deviation ish, based on SSE
want to get a T value that is very big
Predicting signal:
- time series during task vs nontask, convolved to replicate the BOLD signal
Comparing signals:
called “predictors”:
- function of baseline (straight line)
- beta 1
- function of what you expect a voxel’s BOLD signal to look like if it’s activated by the system you’re looking for
- beta 2
- function of what you expect a voxel’s BOLD signal to look like if it’s not activated by system you’re looking for
- beta 3
This is the X matrix
- add these three functions together at different weights to approximate what you see in that voxel signal
- say weight = w for each
- this weighted sum = appx signal of that voxel
- b1w1 + b2w2 + b3w3 = approximation(v)
- difference in weights between nonword signal vs word signal, show you how likely its part of a language system or no
- w2 - w3
- comparison of betaweights is called a ‘contrast’
- formally, a vector indicating which beta weights we are interested in
- difference between approximation of that voxel and real signal of that voxel is error
- signal(v) - approximation(v) = error(v)
- positive error = your approximation is below the real signal, neg error = your appx is above the real signal
- signal(v) - approximation(v) = error(v)
GLM:
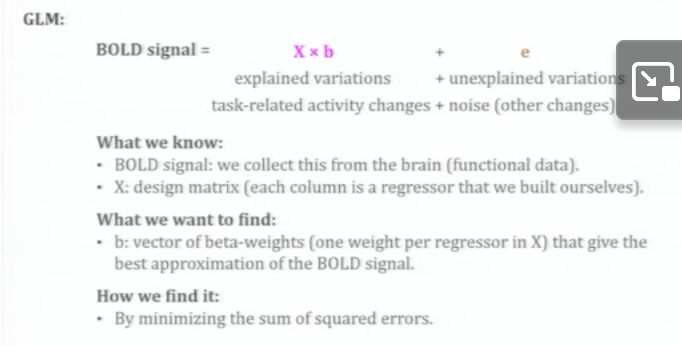
Formula:
b = regress(BOLD_signal, X)
Noise minimization- add more predictors which are approximations of noise functions:
- adds a matrix of potential head movement
- adds a matrix of time derivatives
- etc. other movement/noise functions
- can add these to approximate the signal better